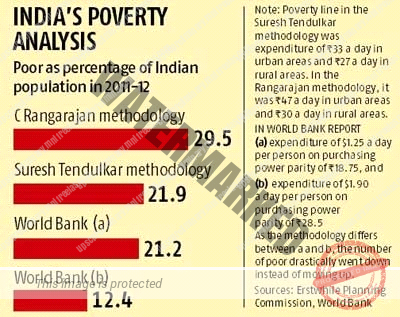
- INDIA’S POVERTY ANALYSIS
- INCOME INEQUALITY
UNIT 12 – ISSUES RELATED TO DEVELOPMENT – PART 4
Poverty line should be based on:
Normative level of adequate nutrition: Ideal and desirable level of nutrition.
Behavioral determination of non-food expenses: What people use or consume as per general behavior.
Nutritional Requirement: For normative levels of adequate nutrition – average requirements of calories, proteins and fats based on Indian Council of Medical Research (ICMR) norms, differentiated by age, gender and activity for all-India rural and urban regions is considered:
Calories: 2090 kcal in urban areas and 2155 Kcal in rural areas.
Protein: For rural areas 48 gm and for urban areas 50 gm.
Fat: For urban areas 28 gm and for rural areas 26 gm.
Poverty Threshold: Persons spending below ₹47 a day in cities and ₹32 in villages be considered poor.
Based on this methodology, Rangarajan committee estimated that the number of poor were 19% higher in rural areas and 41% more in urban areas than what was estimated using Tendulkar committee formula.
In 2015 the government had set up a task force under the chairmanship of Aravind Panagraiya to suggest new method for poverty estimation.
Multidimensional poverty index in India: a report
The global multidimensional poverty Index 2019 has placed India in the top 10 countries which is rapidly reducing poverty.
- India has lifted 271 million people out of poverty between 2006-2016.
- Improvements have been observed in areas such as assets, cooking fuel, sanitation and nutrition.
- Nutrition deprivation has reduced from 44.3% in 2005-06 to 21.2.5 in 2015-16.
- The situation of children is poor as 1 in3 children are multidimensional poor than 1 in 6 adults. Hence it is a cause of concern as malnutrition in children and global hunger index measures are quite alarming. Hence India is working on this respect with strategies like Poshan Abhiyan.
- The main aim of poverty alleviation has shifted from food security to nutrition security.
Income Inequality
Income inequality, in economics, significant disparity in the distribution of income between individuals, groups, populations, social classes, or countries. Income inequality is a major dimension of social stratification and social class. It affects and is affected by many other forms of inequality, such as inequalities of wealth, political power, and social status. Income is a major determinant of quality of life, affecting the health and well-being of individuals and families, and varies by social factors such as sex, age, and race or ethnicity.
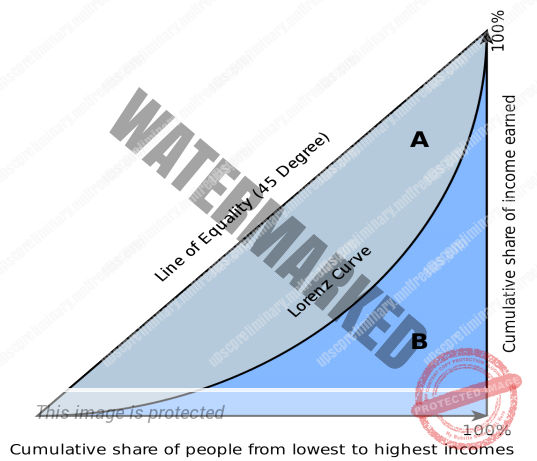
Lorentz Curve:
It shows the income inequality by drawing the line of perfect equality. A Lorenz curve is a graphical representation of income inequality or wealth inequality developed by American economist Max Lorenz in 1905. The graph plots percentiles of the population on the horizontal axis according to income or wealth. It plots cumulative income or wealth on the vertical axis, so that an x-value of 45 and a y-value of 14.2 would mean that the bottom 45% of the population controls 14.2% of the total income or wealth. In practice, a Lorenz curve is usually a mathematical function estimated from an incomplete set of observations of income or wealth.
The Lorenz Curve (the actual distribution of income curve), shows the proportion of income earned by any given percentage of the population. The line at the 45º angle shows perfectly equal income distribution, while the other line shows the actual distribution of income.
- In a perfectly equal society, the “poorest” 25% of the population would earn 25% of the total income, the “poorest” 50% of the population would earn 50% of the total income and the Lorenz curve would follow the path of the 45° line of equality.
- As inequality increases, the Lorenz curve deviates from the line of equality; the “poorest” 25% of the population may earn 10% of the total income; the “poorest” 50% of the population may earn 20% of the total income and so on.
Gini Coefficient:
The Gini Coefficient, which is derived from the Lorenz Curve, can be used as an indicator of economic development in a country.
The Gini coefficient provides an index to measure inequality. It is a way of comparing how distribution of income in a society compares with a similar society in which everyone earned exactly the same amount. Inequality on the Gini scale is measured between 0, where everybody is equal, and 1, where all the country’s income is earned by a single person. It measures the degree of income equality in a population.
Higher value of Gini Coefficient means greater the income inequality
Note: It doesn’t Measuring inequality between different Social groups between Regions, between genders.
The Gini index or Gini coefficient is a statistical measure of distribution which was developed by the Italian statistician Corrado Gini in 1912. It is used as a gauge of economic inequality, measuring income distribution among a population.
The coefficient ranges from 0 (or 0%) to 1 (or 100%), with 0 representing perfect equality and 1 representing perfect inequality. Values over 1 are not practically possible as we don’t take into account the negative incomes. (Income can be 0 at its lowest but not negative)
Thus, a country in which every resident has the same income would have an income Gini coefficient of 0. A country in which one resident earned all the income, while everyone else earned nothing, would have an income Gini coefficient of 1.
As we know now, the Gini coefficient is an important tool for analyzing income or wealth distribution within a country or region, but,
Gini should not be mistaken for an absolute measurement of income or wealth.
A high-income country and a low-income one can have the same Gini coefficient, as long as incomes are distributed similarly within each country